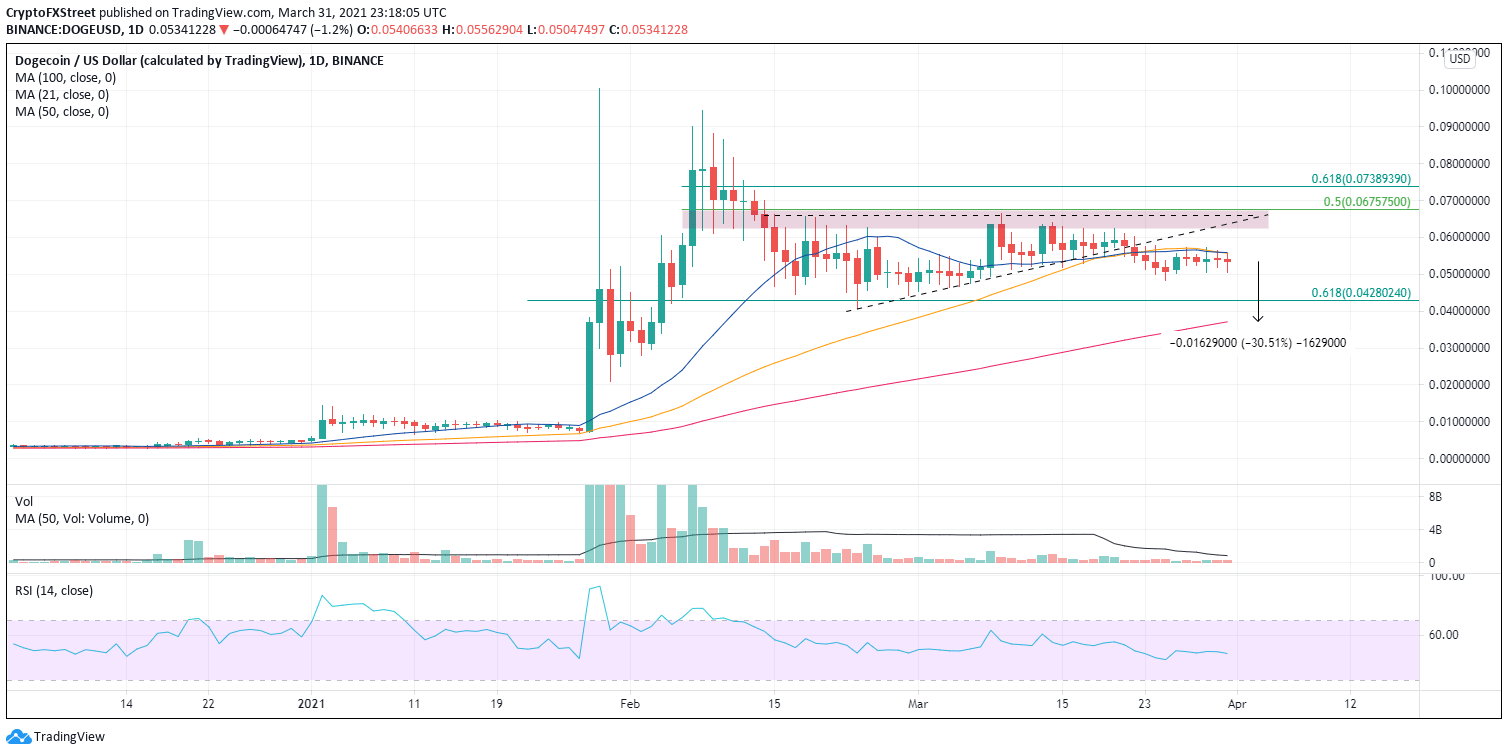
- Dogecoin price being pressured by two declining moving averages.
- Daily Relative Strength Index (RSI) showing temporary equilibrium between buyers and sellers.
- Traders should not lose sight of the deteriorating technical backdrop.
Dogecoin price is failing to capture any buying interest after the 7% spike on March 26. Instead, the altcoin has drifted sideways below two declining moving averages, the 20-day SMA and the 50-day SMA. For now, a conservative mindset is appropriate in this trading environment.
Dogecoin price ignoring improved sentiment in the cryptocurrency market
The decline below the ascending triangle on March 22 was a decisive technical event for DOGE and revealed to traders that media hype could only sustain a trend for so long. Such tranquil price action is not always a precursor to explosive gains.
With the bias tilted to the downside, no credible support emerges for DOGE until the 0.618 Fibonacci retracement at $0.043, followed closely by the February low at $0.040. The next reliable support does not appear until the 100-day SMA at $0.037, which represents a 30% loss to traders from the current price.

DOGE/USD daily chart
A daily close above the 20-day SMA and 50-day SMA would flip DOGE’s bearish outlook to neutral and raise the odds of a rally in the coming weeks to the price range between $0.063 and $0.068. If bulls have the stamina, the 0.618 Fibonacci retracement of the February plunge at $0.074 is a potential target.


